Our client is a large manufacturing company in Europe that aims to use data to improve their production, align with the changing regulations, and keep customers satisfied with high-quality, timely deliveries.
An assessment of the digital state of the company revealed the need for automated data acquisition and analysis on the plant floor and throughout the organisation. The company chose Ignition as the platform for that and Enuda as the partner to bring the ecosystem together. The project started as a SCADA project, but new ideas and user stories have come into play.
Table of Contents
OEE: “How can we improve?”
They didn’t want data just for data’s sake—they had KPIs they wanted to track to make better decisions. One of them is OEE (Overall Equipment Effectiveness), and its purpose is to act as a metric for improving manufacturing processes.
In this case study, we’ll talk about the development of a comprehensive OEE dashboard, designed to provide real-time/historical insights into production effectiveness by tracking factors such as availability, performance, and quality.
The challenges
- Obsolete Data Management: Reliance on outdated proprietary solutions and manual data logging prevented efficient production analysis.
- Lack of Insight: With no scalable infrastructure to connect machines and processes, the company struggled to gain insights into production.
- Data Inconsistency: Operating across multiple sites without standardised data structures led to inefficiencies and difficulties in comparing performance metrics.
Essentially, they didn’t have insight into how the production was going in real-time, let alone into opportunities for improvement.
The solution
The goal was clear: get data flowing to and from a single source of truth in a clear, standardised way, then turn that data into reliable information that solves problems, presented on intuitive dashboards.
Project management
To provide more flexibility and less risk for the client, we divided the project into a couple of work packages. Each work package has an objective that should be achieved within several sprints. Each work package has a plan, clear deliverables, and documentation of all tasks.
Example of an overview of a work package:

The project started with selecting one specific production line for collecting data and creating the necessary dashboards. That approach is completely in line with our general recommendation of starting small and getting something specific in front of the users as fast as possible. In this case study, two phases are particularly important:
- Laying the groundwork: First up, we created a scalable architecture to tackle connectivity issues, standardise data, and enhance cybersecurity.
- Building smart solutions: Next, we developed user-friendly dashboards and mobile solutions.
Connectivity
The deliverables in this phase sounded like this:
- Establish Development/Test/Production environments
- Inserting Ignition licenses in the gateway
- Creating users/roles in Ignition
- Establish security on Ignition Projects
- Implement ISA 95 Data Model.
- Creating Tag Structure based on ISA-95
- Creating UDTs in the Tag Structure
- Enabling historisation for raw data
Each local architecture consists of a single Ignition Gateway connected to the OT networks and a single SQL database. Apart from the local architectural framework, we employ MQTT for connectivity with the headquarter and other sites, ensuring seamless data exchange within The Unified Namespace (UNS). Together with using PackTags from PackML, this approach allows us to maintain a cohesive and standardised data environment across all facilities, promoting efficiency and scalability.
We follow the ISA-95 standard for creating a tag structure via the common data model Enterprise/Site/Area/Line/Cell. Whenever feasible, we aim to construct User-Defined Types (UDTs). This approach is in line with our commitment to The Unified Namespace (UNS), which helps streamline data management and integration across our systems and ensures consistency and coherence in our operations.
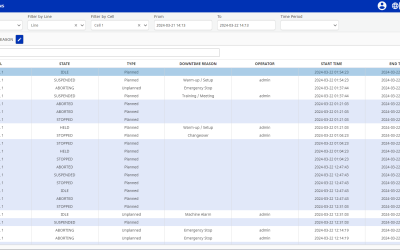
The dashboard


Above is a screenshot from the test phase where we used dummy data to show functionality.
This is an example of a dashboard for Work Order that contains several widgets. For this case study, we’ll focus on the OEE widgets: real-time OEE and historical OEE.
The dashboard contains filters that enable them to choose the exact area, line, machine, shift, and timeframe for which they want to see data. It’s a database-based solution where raw data is stored, and filters are applied in the front end.
The data is contextualised so the responsible person can assess the situation and make decisions faster.
The outcomes
- Visibility into the production: real-time and historical data on key performance metrics is now at their fingertips, revealing opportunities to improve production effectiveness.
- Data-driven decisions: the insights gained from the dashboard empowered the company to make smarter, evidence-based decisions to enhance efficiency.
- Unified standards: The shift to a standardised data environment means performance metrics can be uniformly applied and assessed.
What’s next?
Creativity flows when problems are solved. The responsible team on this client’s side is one of the most enthusiastic and creative we’ve met—the more pain points are gone, the more ideas they generate for smarter, faster analysis. Aside from improving on the current solution, we dive into other KPIs that will show stakeholders actionable information and make the operators’ lives easier.
Lessons learned
Foundation first
A solid digital infrastructure is essential for leveraging real-time data and implementing SCADA and MES solutions effectively. Ignition becomes the single source of truth for data coming from different sources. We standardise it for clarity and scalability, then, from there on, you can pick the data you want and use it for the functionality you want.
Iterate and improve
Start small, learn from the initial rollout, and then scale up based on those insights. We use the agile methodology for this exact purpose: every sprint must have an output. We get feedback on it, and we build upon it with every new delivery.
OEE is different for everyone
The above screenshots are just an example. It’s the dashboard we built for this client as they asked. Depending on your company’s situation, needs, and beliefs, the front end may look different. In the backend, however, calculations and programming usually look similar.
One of the biggest hurdles in digital transformation projects is connectivity. If you want to know how we deal with that and the Unified Namespace, watch our demo on YouTube.