Just like a sheet of musical notes turns into a song that inspires you to go out for a run, data turns into reliable information that changes behaviours.
The data must be correct and reliable—no violinist can play if the notes are messed up. But if you’re not the violinist, you only care about the music. As for the lyrics, there’s only one that starts on the plant floor and echoes throughout the organisation: “How is it going?”.
Table of Contents
Understanding OEE: “How is it going?”
To answer that question, we need reliable data and a front end that makes sense of it. Today, we will focus on Overall Equipment Effectiveness (OEE).
What is OEE?
First of all, it quantifies how well a manufacturing operation utilises its equipment in terms of availability, performance, and quality. Think of it as a health check-up for machines.
Second of all, it also involves the processes, or how you run your machines. For example, you could have low performance on the machine because it’s waiting for something – some raw material – from further up the stream. That will result in low Performance, and, thus, low OEE, but has nothing to do with the machine per se. That’s information for you.
Essentially, OEE provides insight into the efficiency and effectiveness of a manufacturing process by identifying areas where improvements can be made to increase productivity. It’s calculated as a percentage and can be broken down into three main components:
- Availability: This measures the proportion of scheduled time that the equipment is actually available for production versus downtime (which could be due to maintenance, breakdowns, or setup time). It is calculated by dividing the actual production time by the planned production time.
- Performance: This measures how well the equipment performs when it is running, compared to its maximum speed. Factors that can affect performance include minor stoppages, idling, and reduced speed. It is calculated by dividing the (actual output / actual production time) by the maximum possible output within the same time frame.
- Quality: This measures the quality of the products produced, specifically the proportion of good quality products compared to the total output. It takes into account products that need to be reworked or scrapped. It is calculated by dividing the number of good units produced by the total units started.
The formula for OEE is:
OEE = Availability×Performance×Quality

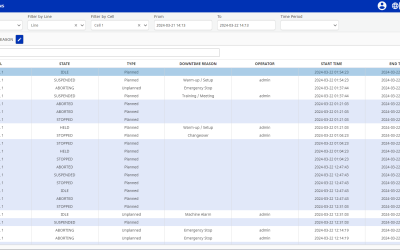
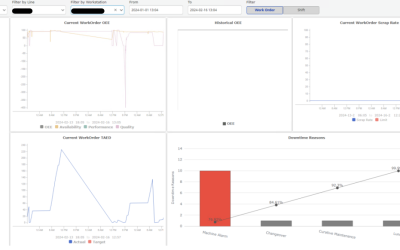
Please note that this is just an example, a test. We used dummy data for it.
Clients come to us with 3 main pain points related to OEE:
- They need a metric for continuous improvement (it’s not a done-and-dusted thing, but a metric for an ongoing journey of improvement)
- They need to use it for performance comparison between different sites
- They need to show the stakeholders that they comply with the regulations
OEE as a metric for continuous improvement
You want to calculate OEE because you want to improve something: a process or a human behaviour. To do that, you need to know where you are today so you can improve tomorrow. Therefore, you need reliable data.
It’s important to know that OEE and other related KPIs are rooted in the LEAN movement. The core of that movement is the idea of continuous improvement—an ongoing process based on reliable information.
Our suggestion is that absolute numbers matter less. What matters more is the trend that the data shows. You use whatever the latest number was as a point of comparison, and observe the trend – are you improving or not?
Here’s an analogy:
Imagine you’re trying to lose weight. You step on the scale, and it gives you a number. But what if you get a different reading on another scale? You might end up with three different scales and three different numbers. The point? It’s not about the exact number – it’s about seeing that number go down over time. Pick a scale and stick with it.
What is required to start calculating OEE?
Access to data. Full stop. Without connectivity, enabled by a clear, scalable architecture, to get data from different sources to one single source of truth, you can’t think about OEE. You need a continuous, seamless flow of high-quality data put in a standardised structure.
We won’t be going into too much detail here, but if you’re interested in this step, check out our video on how to build a Unified Namespace.
OEE is pretty clear… or is it?
The formula is pretty straightforward, but, in our experience, people confuse OEE with other metrics and/or misapply it in the different contexts going on simultaneously in a factory.
OEE is not the same for all stakeholders
OEE is not a “thing”. It’s many things depending on the purpose – and it even looks differently depending on the interpretation of the company.
Inside the same organisation, you can have different types of OEE depending on the need. You can have one type of OEE with senior management, another with production planning, and a third with operations management on the factory floor. These three different types serve different purposes and can’t be compared. Think of it like buying a car: we all know what a car is, but we have different ideas about what “a good car” looks like.
Here’s an example. Let’s take the essential element of “Availability” from the OEE formula and break it into sub-categories in a specific order:
- Closed ➔ for example, the line is closed for some reason (weekend, vacation – nobody works)
- Overcapacity ➔ Basically, the line is ready, people are on duty, but you do not need to run it a full shift.
- Maintenance ➔ Planned maintenance. For example, a day every month or similar.
- Setup ➔ Planned larger setups and changes in production. Includes cleaning, larger changes.
- Supply ➔ Unplanned: Lack of something outside the line. For example, electricity failure, no people, starved from upstream or lack of input material for the line.
- Change over ➔ Small changes
- Break down ➔ Unplanned, longer stops of the line. Not only technical (machinery), could also be a lack of people
For 1: there are no labour costs involved, but still, you have an opportunity to run the line more.
For 2, 3, 4: All of these are planned, and normally still involve labour costs and they represent an opportunity for improving output.
For 5, 6, 7: All of these are unplanned and represent an opportunity for improvement.
With this example, you can see three different levels and, thus, three effectively different types of OEE:
- The senior management considering new investments would look at the entire stack because the total represents an opportunity for getting more out of what you already have.
- The production planning people would ignore when the line is planned out of production.
- The person in charge of daily operations would primarily focus on unplanned downtime because that represents a massive opportunity for improvement.
Therefore, they would each calculate their specific OEE to target exclusively the opportunities they are responsible for. And the result will be three different types of OEE for the same organisation.
These three can’t be compared, but you can (and should) work on improving on each level.
Wrap-up: OEE is not just one thing—it’s a KPI that needs different data for different stakeholders and levels of the organisation. However, the objective is the same: find paths for improvement.
OEE, OOE, TAED, TEEP: The relation between KPIs
What do bird sounds have to do with your equipment’s performance?
Oh, wait, they’re not bird sounds… It’s just the confusing trap we step into in an effort to save time, but we end up sacrificing clarity: abbreviations. Let’s fix that.
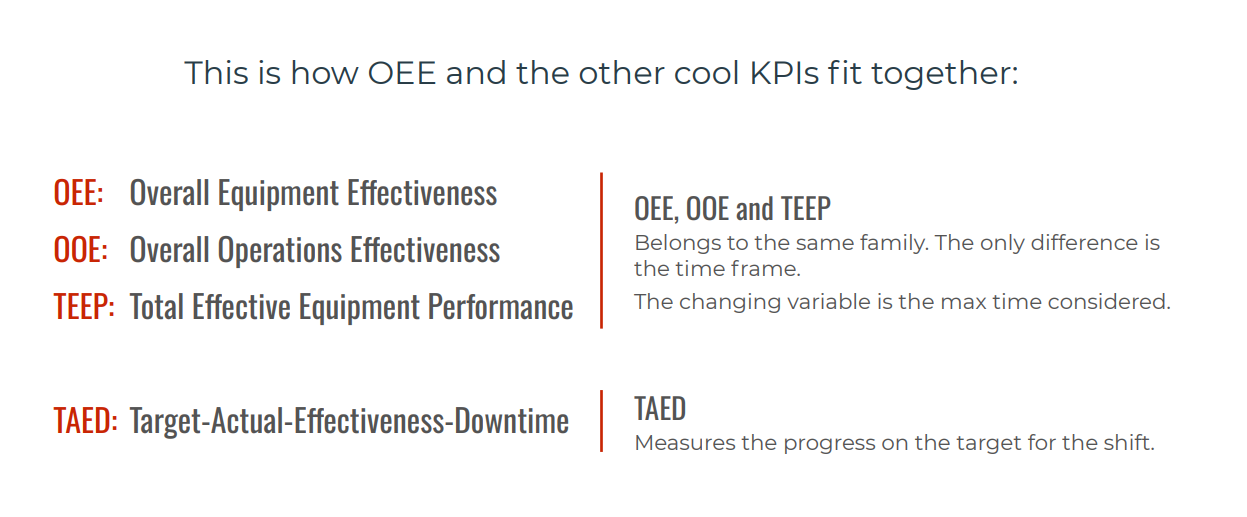
- OEE focuses on the efficiency of specific equipment or production lines, measuring availability, performance, and quality.
- OOE expands on OEE by considering all available time, not just scheduled production time, to assess the total potential of the manufacturing equipment.
- TEEP takes an even broader perspective, evaluating the effectiveness of the entire manufacturing operation, beyond just the machinery and production lines.
The same reliable data is used for different purposes. OEE is used on the shop floor by operators and managers for daily improvements, while OOE and TEEP are used by the Head of Operations and senior management for longer-term analysis and planning.
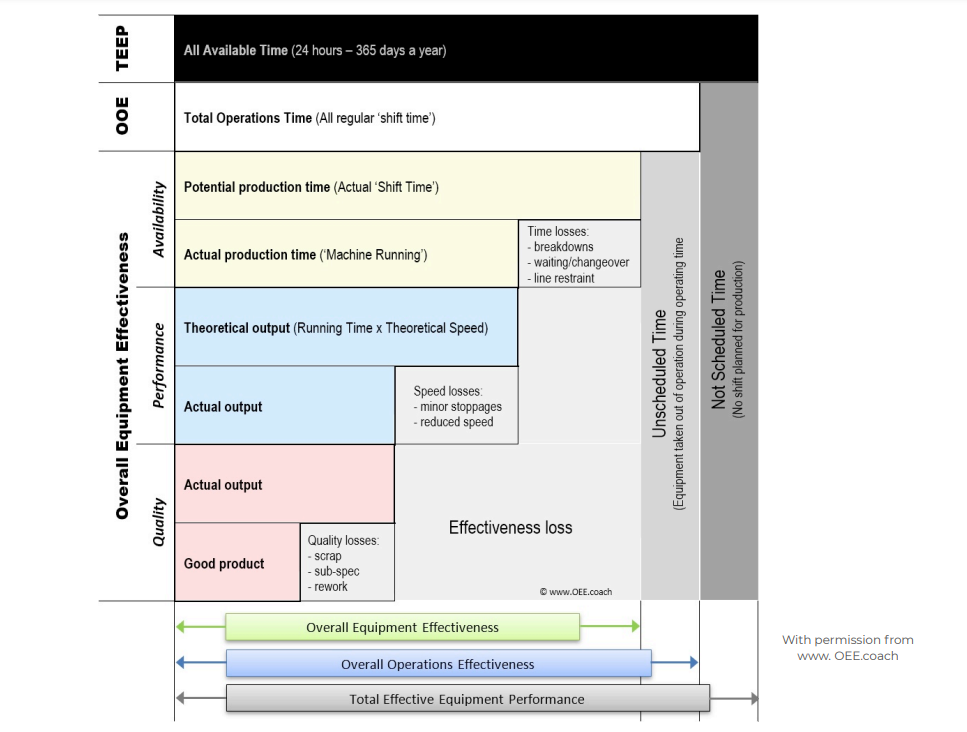
This diagram by Arno Koch is a fantastic representation of the similarities and differences between OEE and the other KPIs. You can more easily understand the elements of each.
However, here’s where manufacturers run into trouble: the definitions of each element, big and small.
Of course, we assume you know the essential information: total operations time, potential production time, theoretical output, what a good product looks like etc. However, don’t sleep on the need to align on ALL definitions: how is a changeover conducted? What does a minor or a major stoppage look like? How do you differentiate a re-workable product from a lost one? When do you assign the production time and effort to re-work a product?
All of these seemingly small details have a huge impact on your possibilities for improvement.
Wrap-up: OEE, OOE, and TEEP are similar, but serve different business purposes. To get started on calculating them, be clear on the definitions of each and what data you have and use to calculate each.
Considerations on how to get started
There’s no one-size-fits-all way to navigate this, but we have recommendations from what worked for us and our clients:
- Agree on the definitions: Make sure everyone agrees on what counts as downtime, setup time, and so on. You can pick one line or machine and use that as a pilot to reach clarifications on definitions.
- Build a strong base: Know what data you have, what you need, and why you’re measuring in the first place.
- Start small and bottom-up – pick a problem area and work on improving it, using the “Six Big Losses” as a guide.
The “Six Big Losses”:
Availability: Unplanned stops and Planned stops
Performance: Micro stops and Slow cycles
Quality: Production rejects and Start-up rejects
If you realise the importance of tracking these KPIs, but you’re reluctant to take action, just know that we have a project roadmap and some ready-made tools that can be used as templates to get you started.
The framework is for a SCADA project, but many steps, especially the phase of collecting data (connectivity), can apply to a MES/OEE project.