The client is a utility company serving over 330,000 citizens in Denmark. It’s a huge organisation, with several plants, and a truckload of data to work with.
Table of Contents
THE CHALLENGE
Our client needed a more sophisticated data aggregation solution than what Ignition provided initially, in order to see their data divided into groups by hour, week, month etc.
They needed to take a look fast at the aggregated data, analyse it, and draw conclusions to help with achieving business and operational goals.
THE SOLUTION
Dragana, our database expert, has done a tremendous job at building a data aggregation solution that meets our client’s requirements to a tee.
Before we get into it, let’s quickly define data aggregation.
Data aggregation is the process of gathering raw data and presenting it in a summarized format. Think of it like an unsolved puzzle that will reveal a valuable image after you put it together.
The Overview
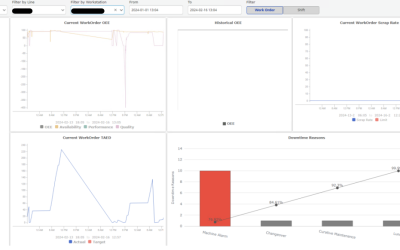
Here’s what the trend tool looks like today:

This is an Easy Chart in Vision, in Ignition. We can see data for a chosen tag and for chosen properties. Simply, with a single click, we get to see data in the chart.
But what happens behind the click?
Database work

This is a classical example of a solution looking simpler on the front-end than it was building it behind the scenes. One thing we can say for sure is that this is a complex solution, and one of Dragana’s important achievements.
As you can see in the above image, there are a lot of things going on.
We have the Database Solution as the main point and then Tables, Stored Procedures, Filling holes, Making Intervals, Making the Aggregations, and Partitioning. Each of these parts is playing a role in the solution. Each part is equally important.
Let’s dive deeper into some of them.
Aggregate function

We need functions for aggregation. Because this solution is fully based on the database, we rely on Aggregate Functions in SQL. We use aggregate functions in SQL for performing calculations on an entire column. Here we have a table with a definition for the basic aggregate functions.
Tables
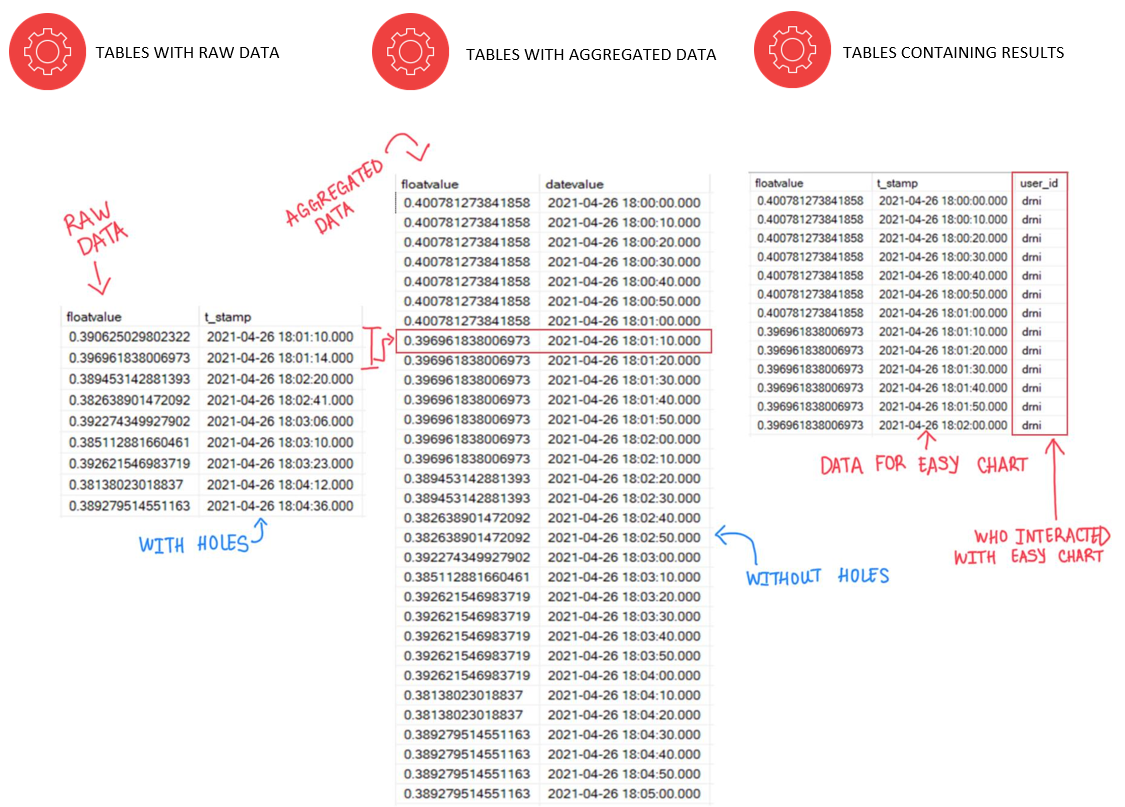
We use tables for 3 different reasons:
- The first one is keeping the raw data or pieces of the puzzle.
- The second reason is keeping the aggregated data.
- And lastly, we need tables that are going to be used in Ignition.
In the first table, as you can see, we have messy values for the dates and a lot of holes (holes are pauses in time where there’s no data loaded for reasons such as: the value hasn’t changed, the connection was down etc).
In the second table, we see 10 seconds intervals and we see much more organised data—data from which we can make 5-minute aggregations, then 1-hour aggregation, and 1-day aggregations.
The third table comes into play, chooses a tag path, aggregation mode, and date range, and these results are shown in the Easy Chart in Vision.
The pyramid

We’re making 10-second intervals, then 5-minute aggregations, 1-hour aggregations, and daily aggregations.
The pyramid is no coincidence. Each one depends on the one that’s below. That means, if we want to make 5-minute aggregations, we need to have 10-second intervals ready. If we want to have hourly aggregations, we need to have the 5-minute aggregations, and so on.
Stored procedures
A stored procedure is a prepared SQL code that you can save, so the code can be reused over and over again. We organize the code in stored procedures because we want automation. We don’t want to create the aggregations manually, we want to write the code and set the stored procedure to run at a time.
In the stored procedure, we have code that literally finds the tag path, the aggregation mode, and the date that a specific user chose.
Wrap up

Let’s repeat the process briefly, shall we?
1. We have raw data, which is then used in the stored procedures that execute over and over again and generate aggregated data.
2. This aggregated data is used by the stored procedures called in the Named Queries in Ignition so that a user can see the wanted results in the Easy Chart.
3. Now, we have a happy client. And a happy team.
For us, the main challenge wasn’t to get the solution to make the calculations, but to bring down the execution time. The amount of data handled was staggering and that results in an execution time of several seconds, which is annoying to the user.
Thankfully, with a lot of ambition and skill, we’ve built an amazing solution that made the user’s life easier.
THE OUTCOME
The tangible result of this solution is the fact that our client can now see their data in a more organised and understandable way, so they can analyse it and gain insights that will help in achieving their business and operational objectives.
Final thoughts
The aggregation pyramid is the core data motor running everything behind the scenes to make the data available in the Trend Tool.
The solution is part of our client’s initiative to move forward towards digitalisation using Ignition and enhancing their operational performance to deliver high-quality services to hundreds of thousands of Danish citizens.