The cold season is slowly approaching (well, maybe not that slowly – am I right, Denmark?), and this one is particularly tricky because of the economical and political situation of Europe and the world. Therefore, companies like the one we’re presenting today ask themselves now more than ever: “how should I use my assets to cover the heat demand in the most optimal way?”
Odder Forsyningsselskab I/S is a utility company in Odder, Denmark. It supplies the Odder Municipality, with a population of over 22.000 Danish citizens, with water and district heating.
Table of Contents
The purpose
The primary focus for Odder is to deliver sufficient heat into their district heating network.
Odder contacted us to build a solution that would answer the question:
Based on the calculated heat demand for the coming period, how do I run my assets in the most financially viable way, taking the physical and practical constraints into consideration?
Basically, Odder wanted to optimise the production plan of the combined heat and power plant (CHP) to find the most profitable production strategy.
About the production plan
A production plan helps organisations make the production process as efficient as possible.
From estimating product demand based on historical production trends and new potentially relevant trends in the market to choosing the least costly and most resource-consuming strategy, production planning is essential for an industrial company.
As a timeframe for planning, the coming 24 hours are the most important, but it’s also necessary to have an additional 24 hours ahead of that period. Therefore, the plan covers 48 hours of rolling and is updated every 24 hours, with the current hour at the top of the plan.
The system consists of 4 assets:
- Heat accumulator ➡︎ A place to store heat, which gives a lot of flexibility in production planning.
- Gas boiler ➡︎ A simple boiler, using gas as fuel and the output is heat.
- Gas motor ➡︎ Using gas as fuel and can produce both heat and power
- Heat pump ➡︎ Air-to-water unit, uses power as input and produces heat.
Assets no. 3 (gas motor) and no. 4 (heat pump) are linked to the power market, and therefore the power price impacts the optimal production plan.
The solution
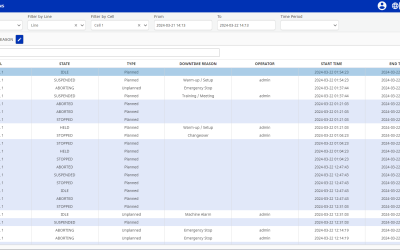
The output of the solution is a production plan for the entire system, split into each asset, all of it on an hourly resolution. The production plan tells, on an hourly basis, how each asset should run (and how each asset has been running, as historical data). As part of this, it also considers necessary Ramp-up and Ramp-down times.
The solution covers, among others, these requirements:
- Each row is 1 hour.
- The current hour at the top
- Each asset has 3 columns: DayAhead, Rev_Plan, and SCADA
DayAhead
A standard DayAhead plan covers the period from 00.00-24.00. According to the market rules for power trading, it has to be fixed and locked before 12.00 today and will cover the 24-hour period from coming midnight and 24 hours ahead, hence the name “DayAhead”.
After 12.00 p.m. today, when the trading has taken place, the plan is locked and is considered a legal obligation.
The DayAhead plan is an output from the Optimisation Model, and it’s the best estimate on how to operate the system given the circumstances: weather forecast (heat demand), fuel prices, power prices, and available assets.
Rev_Plan
As always, things happen, and you need to remain flexible in order to make a new plan – a revision, if you like.
For example: tonight, we’re running according to a plan (DayAhead) made yesterday before 12.00 (after 12, the plan is locked). But since then, some things may have changed:
- New weather forecast ➜ resulting in a different heat demand
- Technical problems with an asset
- Changes in power prices ➜ resulting in a different optimisation
The column “Rev_Plan” is any updated revision of the production plan. These values will come either from running the Optimisation Model again sometime during the day, or alternatively from a manual entry.
Thus, it’s possible to update the column “Rev_Plan” manually. Most of the time, however, the Rev_Plan column will be empty because the production plan will just follow the original DayAhead plan.
SCADA
We’re talking here about the actual, real-time values from the assets.
If the planning process works, these real-time values equal the Rev_Plan. In the best of all worlds, we have an updated plan – Rev_Plan – and our system is running according to it.
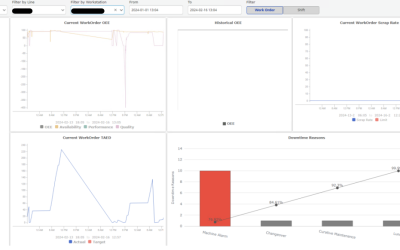
The system
The system is divided into 2 main parts or 2 questions:
Heat demand –> how much heat, per hour, measured in MW, is needed in the coming 48 hours? (the answer comes from heat demand forecasting)
Heat production –> how heat is produced over the coming 24 – 48 hours, to cover the heat demand, using the 4 assets:
- Gas motor
- Heat pump
- VAK – heat accumulator
- Gas boiler
The Optimisation Model
Instead of inserting here a chunk of text about how we build the model and how we use Ignition for this machine learning solution, why don’t we invite you to see a video walk-through of it? Check out our YouTube playlist on Machine Learning to discover how to do it or check out our article.
Data sources
We need a lot of data not only to feed the optimisation model, but to actually build an effective solution that takes into account all the necessary variables to provide a good production plan.
1. SCADA information
– Real-time data on temperatures and flow in the system. For example, flow to and from the accumulated out-door air temperature.
– Availability of plant asset (maybe out for maintenance, and also linked to time. For example, “gas motor not available for the coming 72 hours”).
– Operation of an asset – is it running or not?
All SCADA values will be stored in the Tag Historian for further use in the optimisation process.
2. Metrological data
We need the weather forecast data. For example, outdoor temperature and maybe wind (to be used for heat demand forecasting).
This is available online via a subscription and an API.
3. Day (or calendar) information
We need information about what day it is – normal work day/weekend/public holiday.
The heat demand profile is slightly different depending on this information.
4. General static information (at least semi-static)
– Technical information about plants. For example: Efficiency_Gasboiler, ramp-up time, Max load, Calorific_Value_Gas
– Financial information: Tariffs, taxes, maintenance cost, ramp-up cost.
5. Price information
Mainly gas price and power price (both buying and selling). This data source is super dynamic, as prices change all the time.
These are available online via a subscription and an API.
6. Stored historical data
- Heat demand = the output from the heat demand forecasting
- Total production = sum of the production (hopefully equal to Heat Demand)
The Heat Demand column should allow for manual editing in any hour (the info is coming from the heat demand forecasting model, but sometimes the operator makes the judgment to change a value in a certain hour. If so, the new value will be the actual until other changes). This means that the column is bi-directional.
The overview
The production plan consists of multiple smaller pieces that should be put together to form the whole production plan with the optimisation model, which was a challenge.
Here’s an overview of the solution:

Ignition gets real data from the weather forecast API as well as from the existing SCADA system (that gives us data about the aforementioned assets/variables), then these values are stored in the database.
When you start the optimisation process by clicking on a button in Ignition, Ignition calls a process in Flask and “activates” the model. The model gets its data from the database, makes the needed calculations, and gives us new predictions. When the model is done, it sends the new values to the database, from which Ignition then gets the new data and presents it to us on an intuitive HMI in Perspective – that’s basically the new production plan.
While there are some fixed variables, there are also variables we can manipulate when we view them in Perspective – if we change a value, it’ll be updated in the database.

Think of this as a zoom-in into the process described above, but this time only Ignition and the database are on the stage.
Ignition sends the data (again, from the weather forecast and the existing SCADA) to the database. In this process, we’re using scripts, named queries, and calling stored procedures to insert the variables (temperatures, power prices, gas prices, assets, taxes, availability) and store them in the database. In the database work, we have resources like Tables, Functions, and Stored Procedures to make all of this possible. Whenever needed, Ignition will then get the data from the database.

Ignition has a small window/view, like a small HMI, where we have a button to start the optimisation process, meaning that we call for the model to start working. At this point, the model will ask the database “will you please provide me this data so I can start working?”, and the database will kindly accept. When the calculations for the new values/production plan are done, the optimised production plan will be saved in the database, all ready for Ignition. Then, Ignition will “refresh” the view (the table with the respective data, presented in the solution in Perspective) and will show us the new values.
In a nutshell, it goes:
Weather & SCADA data > Ignition > Database > Model > New optimised production plan data > Database > Ignition > Visualisation of the new production plan, built in Perspective.
The benefits
There are a number of cool things that came out of this project:
- Automated tedious tasks,
- Advanced technology (machine learning) was used to ensure an optimised production plan based on key data, which enables Odder’s operation to be more cost-effective and efficient, as well as more focused on how to best deliver to their customers,
- The data can be easily understood and acted upon thanks to the intuitive visualisation solution.
… and more will be added as the project moves through the testing phase (we’re already a few weeks into that) and finally into production.
Thanks to their interest in advancing their production planning by bringing machine learning and Ignition to the table, Odder is now set for a more focused, optimised, and profitable strategy. It’s a win-win situation for the company and for its customers, and for Enuda, the project strengthened our skills in building and implementing advanced solutions. Ignition enabled us to meet Odder’s needs and requirements, and it’s always amazing to see what’s possible on such a powerful industrial software platform.